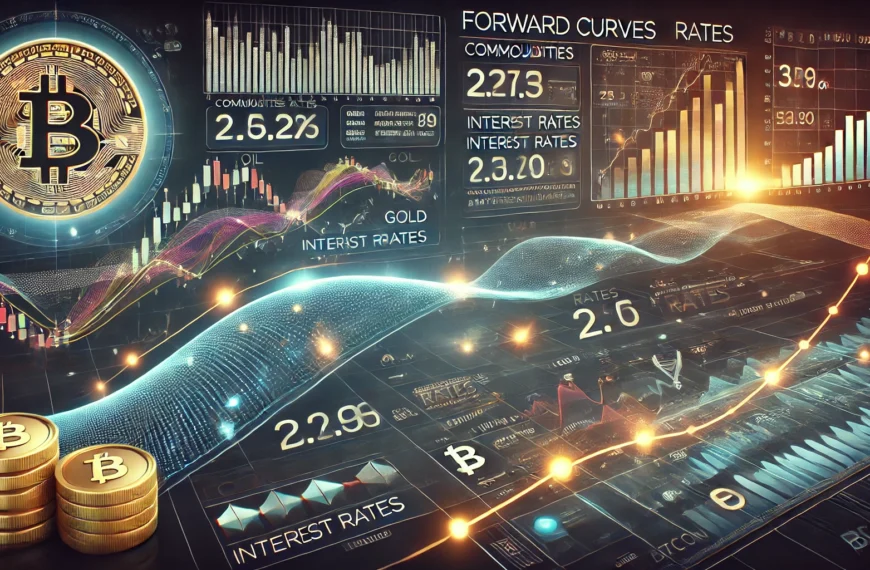
In the world of finance, there are a few key tools that help investors and traders navigate the complexities of market behavior. Among them, the futures curve stands out as a crucial indicator that offers valuable insights into market expectations. Whether you’re a seasoned investor, a novice trader, or someone just starting to understand financial markets, the futures curve can be the difference between making a timely, profitable decision and missing out on an opportunity.
At its core, the futures curve is a visual representation of how the market expects the price of a particular commodity or financial instrument to change over time. It’s not just a line on a chart; it’s a reflection of the collective sentiment of all market participants. The shape of the curve whether upward sloping, downward sloping, or flat holds the key to predicting future price movements and understanding the broader market sentiment.
Understanding the futures curve is vital for several reasons. First, it provides insights into supply and demand dynamics, offering a glimpse of potential future shortages or surpluses. Second, it can help investors manage risks by locking in prices through futures contracts. Lastly, it can offer clues about broader economic trends, such as interest rate changes, geopolitical events, or shifts in market sentiment.
We will explore the dynamics of the futures curve, discussing its relevance, its impact on investment strategies, and how to interpret its various shapes. By the end, you’ll have a deeper understanding of how this powerful tool can help you make more informed, data-driven decisions in your financial journey. Whether you’re looking to hedge your investments or speculate on market movements, grasping the concept of the futures curve is essential to navigating the world of finance effectively.
What Is the Future Curve?
Imagine you’re standing at a bus stop, waiting for the next bus. Right now, you’re at the present moment, and the buses represent future deliveries of a commodity, such as oil or gold, at different times. The prices displayed on each bus are what you’d pay to secure that commodity for each future date. Some buses might show a higher price, while others display a lower price. This is a simple way to think about the futures curve.
The futures curve works similarly. It’s a graphical representation of the prices of a specific commodity, financial instrument, or asset at different future dates. The curve illustrates how the market expects prices to evolve over time, based on various factors such as supply and demand, geopolitical events, and economic indicators. It’s like a snapshot of market sentiment that helps traders and investors understand where prices might be headed.
The curve itself can take different shapes, and understanding these shapes is key to making informed investment decisions. The most common forms of the futures curve are contango and backwardation.
- Contango: This occurs when futures prices are higher than the spot price (the current market price). In this case, the curve slopes upward. Contango usually indicates that traders expect the price of the commodity to rise over time. The higher prices in the future may reflect factors like storage costs, carrying costs, or expectations of growing demand.
- Backwardation: On the flip side, backwardation happens when futures prices are lower than the spot price. The curve slopes downward in this case. Backwardation suggests that the market expects the price of the commodity to decrease over time. This can happen when there’s a shortage of supply in the present, driving prices up temporarily, but traders expect the supply issue to resolve, causing prices to fall in the future.
By understanding the futures curve and recognizing whether the market is in contango or backwardation, investors and traders can gain valuable insights into market expectations, supply and demand shifts, and potential price movements. This understanding is crucial for making informed decisions and managing investment strategies effectively.
The Futures Curve as a Tool for Investors
How the Futures Curve Reflects Market Sentiment
The futures curve isn’t just a tool for predicting prices; it’s a reflection of what the market collectively believes about future supply and demand dynamics. As such, it can offer profound insights into the collective psychology of traders and investors. The curve visually represents the aggregated expectations of thousands of market participants, incorporating a variety of factors that influence future pricing.
One of the most important things the futures curve reveals is how the market anticipates supply and demand changes. For instance, if there’s news of a potential disruption in the supply chain of a commodity—like oil—this may lead to an upward shift in the futures curve. This shift signifies that traders expect future prices to rise due to a potential shortage. Conversely, if the market anticipates an increase in supply, such as new production from oil fields, the curve may slope downward, indicating that prices are expected to fall.
The futures curve is also influenced by external factors like interest rates and geopolitical events. Changes in interest rates, for instance, can affect the cost of carrying or storing commodities. Higher interest rates may make it more expensive to hold onto physical commodities, potentially pushing futures prices higher. Similarly, geopolitical events—such as conflicts in oil-producing regions can create volatility in the futures curve, as investors react to uncertainties regarding the future availability of commodities.
Understanding the futures curve allows investors to predict shifts in market sentiment, as it acts as a forward-looking gauge. By paying attention to the shape and slope of the curve, investors can get a sense of whether the market is optimistic or pessimistic about the future of a particular commodity or financial instrument.
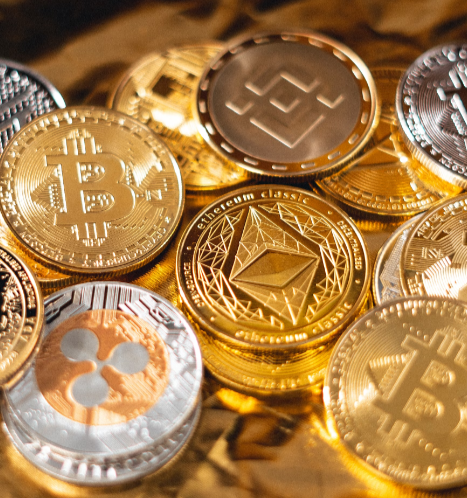
Relevance Across Asset Classes
While the futures curve is most commonly associated with commodities like oil, gold, and agricultural products, its relevance extends far beyond these markets. It’s a valuable tool not just for traders dealing with physical goods but also for those involved in financial instruments like bonds, interest rates, and stock indices.
- Commodities: The futures curve is perhaps most famously used in commodity markets. For instance, in the oil market, the curve can help investors anticipate whether prices will increase or decrease based on supply concerns, geopolitical developments, and broader economic factors. A contango situation in oil suggests that traders expect future prices to be higher, often due to rising storage or transportation costs, while backwardation may signal that current supply shortages are pushing prices higher in the short term.
- Financial Instruments: The futures curve is just as useful in interest rates, bonds, and stock indices. For interest rates, the futures curve can reveal the market’s expectations for future rate hikes or cuts by central banks. A steep upward slope could suggest that the market expects rates to rise significantly in the future, whereas a flat or downward-sloping curve might indicate expectations for lower rates. Similarly, the bond futures curve can help investors anticipate changes in bond yields, which are crucial for those managing portfolios of fixed-income assets.
For stock indices, futures curves can help traders and investors understand the market’s sentiment toward the overall economy. A steep, upward-sloping curve in stock index futures could indicate that investors are optimistic about future economic growth, while a downward slope might suggest a bearish outlook.
The futures curve provides a snapshot of the market’s expectations, helping investors make more informed decisions about when to enter or exit positions, hedge risks, or adjust their portfolios based on anticipated market movements.
By understanding how the futures curve applies to both commodities and financial instruments, investors can gain a broader perspective on the market and better align their strategies with prevailing trends. Whether you’re trading physical goods or navigating the complexities of financial markets, the futures curve serves as a powerful tool for predicting and responding to future price movements.
Practical Applications in Investment Strategies
Interpreting Contango and Backwardation
The futures curve is more than just a theoretical concept; it’s a practical tool that offers valuable signals for investors looking to optimize their entry and exit points in the market. By interpreting whether the curve is in contango or backwardation, traders and investors can gain insights into the broader market trends and use this information to make better-informed decisions.
- Contango: When the futures curve is in contango, it suggests that the market expects prices to rise in the future. This upward-sloping curve typically indicates that traders expect higher demand or rising costs in the future. For investors, this can signal a potential buy-and-hold strategy. If the market is in contango, buying a commodity today and holding it for future delivery might allow the investor to benefit from the upward price movement.
- Market Entry and Exit: If you’re looking to enter the market, a contango scenario might suggest that it’s a good time to buy now and lock in current prices before they increase. On the other hand, exiting during a contango period might not be ideal for those looking for immediate returns, as they may miss out on the rising future prices. The key is to identify whether the futures prices are reflecting expected supply-demand imbalances that could push prices higher.
- Backwardation: When the futures curve is in backwardation, it indicates that prices are expected to decline over time. This usually occurs when there is a supply shortage in the present, which causes immediate prices to be higher than future prices. For investors, backwardation often suggests a short-term strategy or a good opportunity for selling contracts or taking advantage of high prices in the present.
- Market Entry and Exit: A backwardation market may signal that it’s a good time to sell in the short term, as the current price is inflated due to supply issues. If you’re already holding a commodity, selling futures contracts could allow you to capitalize on the immediate price spike. However, if you’re looking to buy, it’s generally better to wait for prices to drop in the future, as the curve suggests that prices are likely to fall.
- Case Study: How Oil Investors Use These Patterns: Let’s consider a scenario in the oil market. When the futures curve is in contango, oil investors may choose to purchase futures contracts, anticipating that prices will rise as demand increases. Conversely, in a backwardation scenario, investors may focus on locking in higher current prices through futures contracts, particularly if there’s an ongoing disruption in the supply chain or geopolitical instability driving the short-term price increase. By understanding these patterns, oil traders can adjust their positions accordingly to profit from the market’s expectations.
Hedging and Speculation
The futures curve plays a central role in both hedging and speculation, two critical strategies used by businesses and traders to manage risk or profit from market movements.
- Hedging with Futures Contracts: Businesses and investors often use futures contracts to hedge risks related to price fluctuations in commodities or financial instruments. By locking in future prices, they can protect themselves from adverse price movements that might otherwise hurt their profits. For example, an airline that knows it will need to purchase a large amount of fuel in the future might buy oil futures to secure today’s price, thereby protecting itself from potential price increases.
- Example: Consider a coffee producer who is concerned about the future price of coffee beans. If they believe that prices might rise due to supply constraints, they could enter into a futures contract to lock in current prices for a future delivery. This way, even if prices rise, the producer is insulated from the price hike.
- Speculation with Futures Contracts: On the other hand, traders can use the futures curve for speculation, betting on future price movements to profit. Speculators aim to predict changes in prices and enter the market at the right time, buying low and selling high or vice versa.
- Example: A trader who believes that oil prices will rise might enter the market during a contango phase, expecting that future prices will be higher. They might buy oil futures contracts, hold them until the expiration date, and sell when the price has increased, making a profit from the price difference. Conversely, in a backwardation market, speculators may sell futures contracts to capitalize on higher current prices, betting that prices will drop once the supply constraints are resolved.
- Speculative Strategies Based on the Futures Curve: Speculators often look for signs of market inefficiencies or trends that they can exploit. For instance, if the futures curve is in backwardation, traders might sell futures contracts in the short term, expecting to buy them back at a lower price once the supply issues are resolved. Alternatively, in a contango scenario, traders may purchase futures contracts, anticipating future price increases driven by higher demand or rising storage costs.
The futures curve serves as a crucial tool for managing risk and capitalizing on potential opportunities. By understanding the structure of the curve, businesses and traders can make more informed decisions about when to buy, sell, or hold futures contracts, aligning their strategies with market expectations and minimizing risk. Whether you’re a business looking to lock in costs or a trader aiming to profit from price movements, the futures curve is a powerful guide to help navigate the financial markets.
Breaking Down the Futures Curve: Key Components
The futures curve may seem like a simple chart at first glance, but understanding its underlying components is essential for making sense of the market’s expectations and navigating the complexities of investing. Let’s break down the key elements that shape the futures curve: spot price, futures price, and time to maturity.
Spot Price vs. Futures Price
- Spot Price: The spot price is the current market price of an asset or commodity, reflecting what it costs to buy or sell the asset for immediate delivery. It’s the price you’d pay if you wanted to settle a transaction right away, essentially the “today’s price.”
For example, if you want to buy gold today, the spot price is what you would pay per ounce. The spot price is dynamic, constantly changing based on supply and demand, market sentiment, and other immediate factors. - Futures Price: In contrast, the futures price refers to the agreed-upon price for a commodity or asset to be delivered at a specified future date. This price is influenced by several factors beyond the current spot price. Futures prices are determined by market participants who are making educated guesses about how the asset will perform in the future. Futures contracts are bought and sold with the expectation that they will be settled at that future date.
While the spot price is an immediate reflection of market conditions, the futures price includes considerations like supply and demand expectations, geopolitical factors, and storage costs for commodities like oil and grain. - Key Differences:
- The spot price is the current price for immediate delivery.
- The futures price is the agreed-upon price for future delivery, and it factors in more variables than the spot price alone.
- Factors Influencing Futures Prices:
- Storage Costs: For commodities that need to be stored, such as oil or grain, storage costs play a significant role in futures prices. If you need to store the commodity for a future delivery date, you must account for the expenses of storage, which will likely be reflected in the futures price.
- Interest Rates: When interest rates are higher, the cost of carrying an asset for future delivery becomes more expensive. This can increase futures prices, as investors demand a premium to account for the opportunity cost of not investing that capital elsewhere.
- Expected Supply and Demand: Futures prices also reflect the market’s expectations about the future balance of supply and demand. If a region experiences a drought, for example, futures prices for crops might rise due to concerns over future shortages. Conversely, if new supply sources are expected to come online, prices may fall.
Time to Maturity
- Time to Maturity: The time to maturity refers to the length of time until a futures contract expires. This factor plays a critical role in shaping the futures curve because it reflects the uncertainty of future market conditions. The further out you go in time, the more factors could affect the future price, leading to greater price fluctuations. In general, as the expiration date of the futures contract moves closer, the price becomes more closely tied to the spot price since the future event is imminent.
- Short-Term Contracts: Contracts with short time horizons say, just a month or two are typically more sensitive to current market conditions. They are often heavily influenced by immediate supply and demand factors. For example, a short-term oil futures contract might be affected by unexpected geopolitical events or sudden changes in production, leading to rapid price shifts.
- Long-Term Contracts: Long-term contracts, on the other hand, tend to reflect more speculative expectations about future conditions. These contracts are influenced by longer-term trends such as economic forecasts, technological advancements, or expected changes in regulatory policies. A long-term futures contract for oil, for example, may incorporate factors like anticipated global demand for energy over the next few years or major infrastructure projects that could change the supply chain.
- Impact on the Curve:
- Short-term contracts often reflect immediate market imbalances or anticipated disruptions, leading to steeper price changes.
- Long-term contracts are typically more influenced by long-term predictions, like shifts in energy consumption, technological developments, or new sources of supply.
- Examples:
- A short-term futures contract might be priced higher than the spot price if there’s a perceived imminent shortage of the commodity. For instance, if a hurricane is expected to disrupt oil production in the Gulf of Mexico, traders may bid up short-term futures contracts due to concerns about near-term supply.
- A long-term contract might be priced lower than the spot price if the market expects over-supply or reduced demand. For instance, if a breakthrough in renewable energy technology is expected to reduce oil demand over the next decade, long-term oil futures might be priced lower than current market prices.
Understanding the impact of time to maturity is crucial for interpreting the futures curve. Short-term contracts may provide insights into immediate market imbalances, while long-term contracts offer clues about broader, more speculative market expectations. By comparing the prices of contracts with different maturities, investors can gauge the level of market uncertainty and adjust their strategies accordingly.
Challenges and Limitations of Using the Futures Curve
While the futures curve is a valuable tool for predicting market trends and shaping investment strategies, it is not without its challenges. Understanding its limitations is crucial to using it effectively. Here are some key factors that investors should keep in mind when interpreting the futures curve:
Misinterpretation Risks
The futures curve can be a double-edged sword. While it can provide valuable insights, it is also susceptible to misinterpretation. Traders and investors may mistakenly assume that the curve’s shape is a guaranteed reflection of future price movements. However, the futures curve is based on market expectations, not certainties. It represents what market participants believe will happen based on current information, but those beliefs can be wrong.
For example, if the market is in contango (an upward sloping curve), it could indicate that traders expect prices to rise in the future, possibly due to factors like storage costs or anticipated supply shortages. But these expectations could change quickly if new information emerges that alters the balance of supply and demand, causing the futures prices to shift unexpectedly.
Impact of Unexpected Market Events
The futures curve is inherently limited in its ability to predict the future accurately, especially when faced with unexpected market events. Geopolitical crises, natural disasters, pandemics, and sudden regulatory changes can all disrupt market dynamics in ways that the futures curve cannot anticipate.
For instance, a sudden geopolitical conflict in a major oil-producing region could lead to a sharp rise in oil prices, even if the futures curve was suggesting a steady decline. Similarly, a global economic downturn could result in reduced demand for commodities, which might cause prices to fall, even if the futures curve indicated a rise in prices due to other market expectations.
These events often result in price volatility that is difficult to forecast, making the futures curve less reliable in such situations. Investors relying too heavily on the futures curve without accounting for the possibility of unforeseen disruptions may be caught off guard by market shifts.
Situations Where the Curve May Not Provide Accurate Forecasts
While the futures curve is a useful tool, it does have its limitations in certain situations:
- Lack of market liquidity: In markets with low liquidity, futures prices may not accurately reflect the broader market’s consensus. In such cases, the futures curve could be distorted by a few large players, leading to price predictions that are out of touch with actual market conditions.
- Short-term market disruptions: The futures curve is better suited for long-term trends and forecasts. In cases where market movements are driven by short-term factors, such as temporary supply chain disruptions or seasonal fluctuations, the curve may not provide an accurate forecast.
- Changing market conditions: If there is a shift in economic fundamentals or a fundamental change in the structure of a commodity market (such as the advent of new technology or regulatory changes), the futures curve may not immediately adjust to reflect those changes. As a result, the predictions embedded in the curve could be outdated or unreliable in such circumstances.
Read more: A Comprehensive Guide to Trump Coins: Types, Prices, and Future Predictions
Conclusion
The futures curve is an essential tool in the investor’s toolbox, offering valuable insights into the future pricing dynamics of various assets. By understanding the shape of the curve whether it’s in contango or backwardation investors can better gauge market sentiment, anticipate potential price movements, and make informed decisions about market entry and exit. It also plays a pivotal role in managing risks and creating hedging strategies.
However, like any tool, the futures curve has its limitations. Misinterpretation of the curve’s signals and the impact of unexpected events can lead to inaccurate forecasts, potentially resulting in poor investment decisions. In markets characterized by low liquidity or short-term disruptions, the futures curve may not always provide accurate predictions, and investors should be cautious in relying on it exclusively.
Mastering the dynamics of the futures curve requires not only a clear understanding of its key components such as spot prices, futures prices, and time to maturity but also an awareness of its limitations. By integrating these insights into a broader investment strategy, investors can navigate the complexities of the financial markets with greater confidence, improving their chances of making timely and profitable decisions in the ever-evolving world of finance.
 By
By